
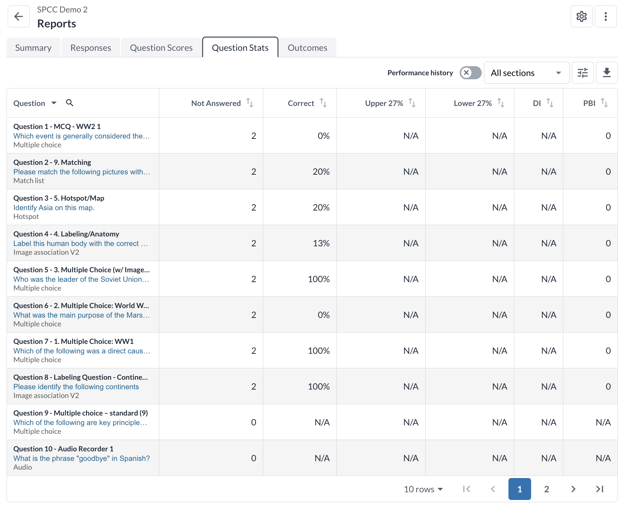
Figure 1: An image of the question stats reports
Questions are displayed one at a time in the report. If a question has a Title set, it will appear next to the Question number header for easier identification.
For multi-part questions, each part is shown indented beneath the question header to display individual statistics for each component.
Clicking on the question stem opens a popup with the Responses Report, which includes additional details such as the full question stem and a breakdown of each unique response submitted.
To quickly find a specific question in large assessments, you can use the search icon to look for any text contained in the question title or stem.
Metrics available
| Metric | What It Tells You |
| Times Shown | The number of times the question was presented to students. This may vary depending on whether the assessment is adaptive or includes randomized question pools. |
| Max Points | The maximum number of points that could be earned for the question. |
| Average | The mean score achieved on the question, calculated across all attempts where the question was shown. |
| Correct | The percentage of responses that were correct. |
| Not Answered | The percentage or count of instances where the question was not answered. |
| Upper 27% | The average score or correct response rate for the top 27% of scorers on the assessment. Useful for evaluating how well high-performing students handled the question. |
| Lower 27% | The average score or correct response rate for the bottom 27% of scorers on the assessment. |
| Standard Deviation (SD) | Indicates how much the scores for the question vary from the average. A high SD may suggest varied performance or question ambiguity. |
| Discrimination Index (DI) | Reflects how well the question distinguishes between high and low scorers. Values typically range from -1 to +1, with higher positive values indicating better discrimination |
| Point-biserial Index (PBI) | Measures the correlation between scores on this question and overall assessment performance. A higher PBI suggests the question is a good indicator of overall ability. |
| Difficulty P-Value (PV) | The proportion of students who answered the question correctly. Lower values indicate harder questions, while higher values indicate easier ones. By default this reflects the current assessment only; switch on Performance history to see the value across every assessment the question has been used in. |
| Median Attempts | The median number of times students attempted the question. This is particularly relevant for assessments allowing multiple attempts or retries. |
| Response Frequencies | Shows how often each answer choice was selected, either as a count or percentage. This is helpful for identifying distractors that may be too obvious or too misleading. |
Performance history. By default, every metric in this table is calculated for the assessment you are currently viewing. Switch on Performance history to see the same metrics calculated across all assessments that use the question, so you can judge whether a question performs consistently rather than how it behaved on one occasion.
Section filtering. If your course is organized into sections of students, you can filter the report to show data for specific sections only. This allows you to analyze performance trends within different groups of students. Select the section name from the dropdown menu to view statistics only for the students in that section.
Performance history across assessments
By default, the figures in this report cover the assessment you are currently viewing. Switch on Performance history to see each statistic twice: once for this assessment, and once across every other assessment that uses the same question — including assessments in other courses and terms.
The toggle appears only when the question has recorded attempts in at least one other assessment.
To see the full breakdown, select the Details icon in a question's row. This opens the Detailed Question Performance History screen, which lists the question's aggregate performance and a row for each assessment it has appeared in. See Overview: Detailed Question Performance History.
Search & Navigation
Use the search icon to quickly locate a specific question in large assessments. You can search by any text in either the question title or stem.
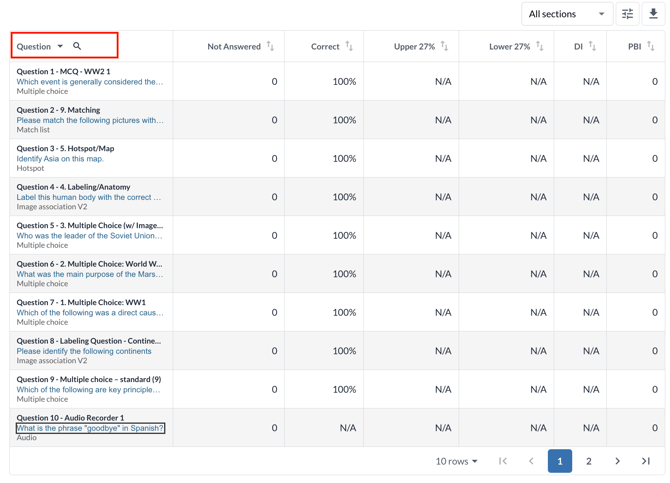
Figure 2: A picture of the Question Search feature
Download a CSV
You can download the complete question statistics data as a CSV file for offline analysis or record-keeping. Click the Download CSV button at the top right of the report to export all available data.
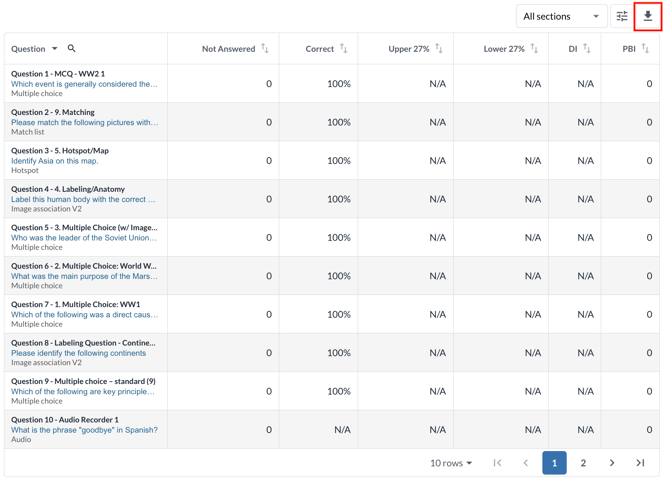
Figure 3: A picture of the CSV Download Feature